Sequential return-chain worksheet
Link supplied same-account returns only across adjacent non-overlapping half-open intervals; keep arithmetic totals separate.
Added 15 October 2026
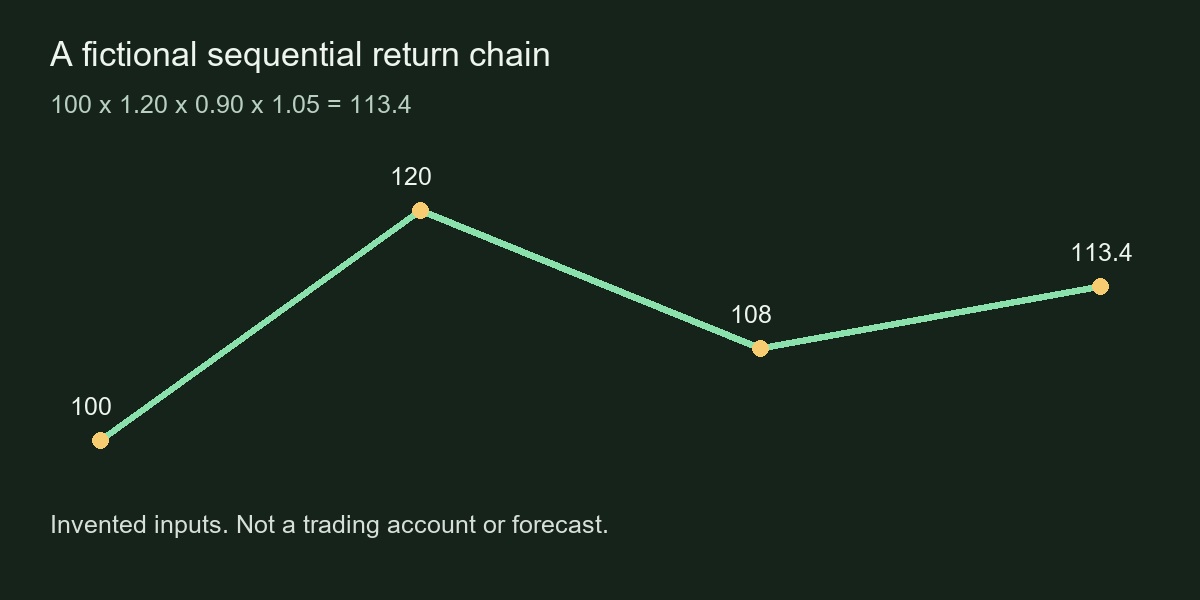
One declared sequential series
This worksheet multiplies compatible return factors for one supplied account, currency and basis. It requires cashflow_adjusted true as a declaration that the entered segment returns already have the intended compatible treatment. The tool does not calculate cash-flow adjustments itself. It sorts segments by start date, checks continuity and retains the sorted IDs. It does not join different accounts or events merely because their dates are adjacent. The caller is responsible for the identity and economic meaning of the series.
Date intervals are half-open
Start is included and end is excluded. A January segment ending on February 1 can meet a February segment beginning on February 1. Dates must be valid calendar dates with end after start. Gaps or overlaps create named findings and suppress the linked output. They are not replaced with zero-return days or silently trimmed. If the source uses inclusive dates, keep its original convention and document any legitimate conversion before entering the worksheet. Do not alter real periods simply to satisfy the software.
Follow the complete authored example
The three invented returns are twenty, negative ten and five percent. An index beginning at 100 moves to 120, then 108, then 113.4. The linked return is 13.4 percent, while the arithmetic sum is fifteen percentage points. The example includes a gap case, overlap case, zero-middle case and terminal-total-loss case. The last produces negative one hundred percent. A total-loss segment before another segment is rejected because a later same-account percentage would need a newly defined capital base.
Precision and input boundaries
The tool uses Decimal.js with 1,500-digit working precision and displays percentages to six decimal places using half-up rounding. It allows one to one hundred segments, unique ASCII IDs and bounded decimal-string returns between negative one hundred and one million percent. It rejects exponents, numeric JSON values and malformed calendar dates. The exact factor is retained as a decimal string in the result. These numerical limits prevent uncontrolled inputs; they do not certify a strategy, a market convention or an economic interpretation.
An arithmetic sum stays a separate output
Even when intervals do not link, the sum of entered percentages can be calculated as arithmetic. It remains labelled arithmetic_sum_pp, while linked_return_pct and factor are null. A sum of overlapping division percentages must not be renamed a same-account compounded result. Neither output calculates investor wealth where capital flows or changing account scope are unresolved. The result is a record-reading exercise. It does not replace an authentic account calculation, a complete fund-performance policy or the organiser's definition of an aggregate.
Review and export the assumptions
The JSON download carries input, sorted identities, continuity findings and unperformed authentication, financial-validation and suitability fields. Editing input retires stale output. Invalid file import leaves the draft intact and export unavailable. Reset restores the fictional example. No trade is placed, no account is connected, and no entered record is sent to the site. For actual financial decisions, obtain the relevant statements and qualified advice. Passing the interval rule is evidence of software compatibility, not evidence that the series is true or complete.